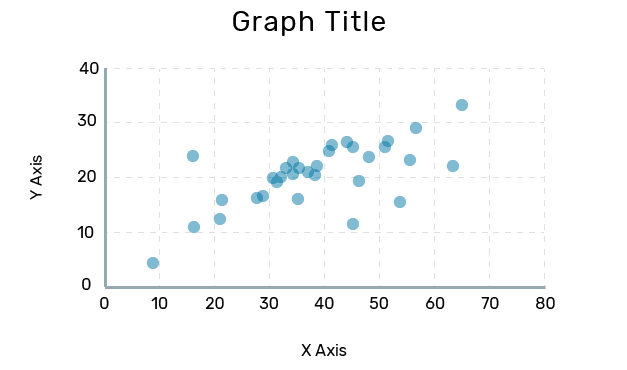
Scatterplots
Scatterplots are used to show correlation between points of data with two variables.
Best Practices
Trend lines aren't necessary, but may help to emphasize correlations in your data. Only use trend lines if they accurately represent a strong correlation.
To show clusters of data, use varying opacity levels on overlapping or near-overlapping data points to show layers, and make each point visually distinct.